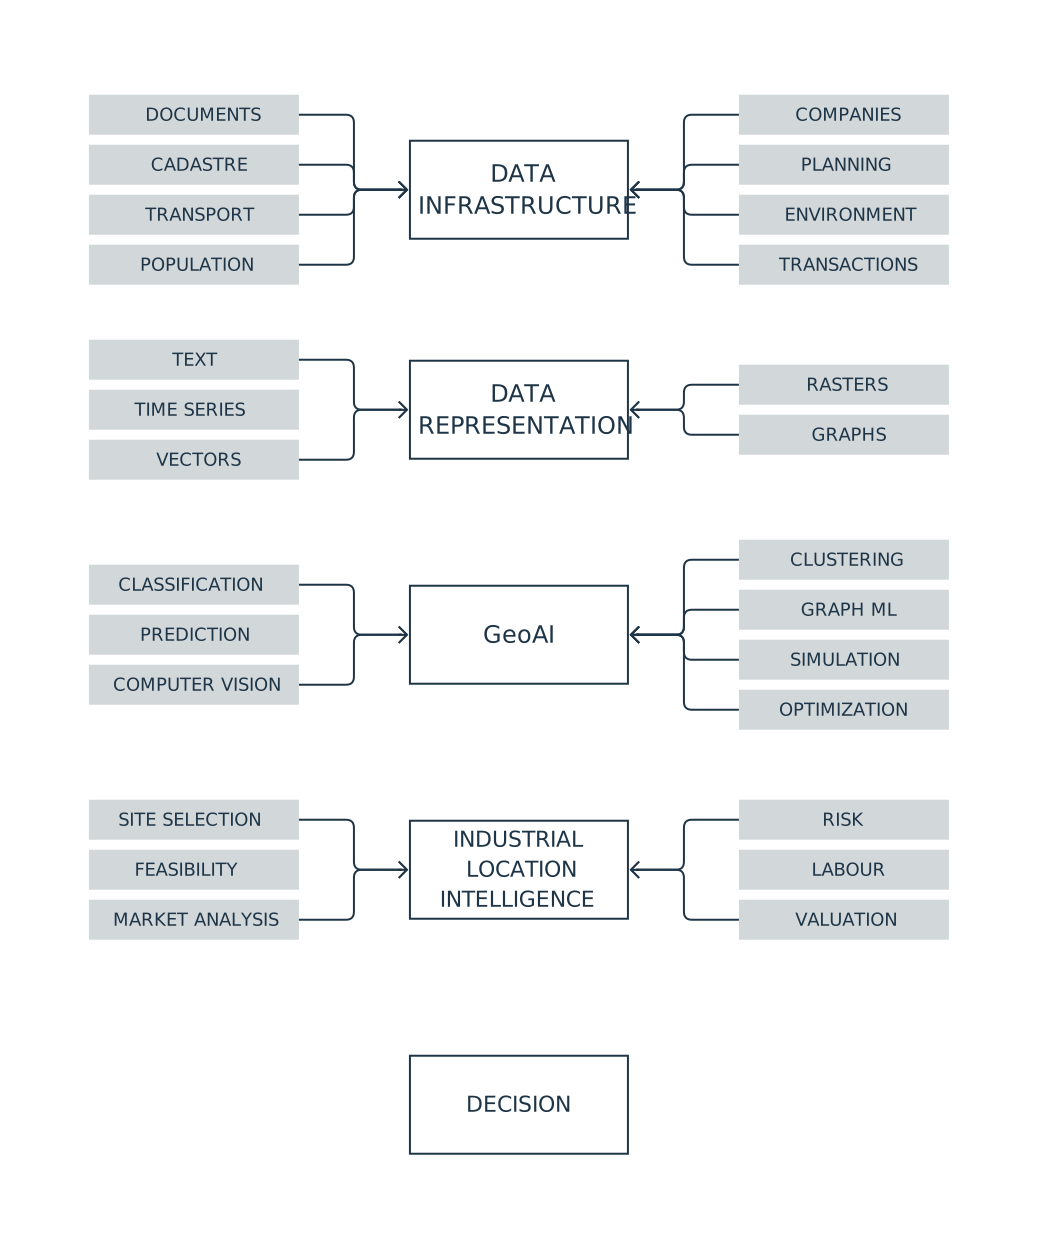
Poland already has a substantial body of data describing its territory, economy and investment environment. For many industrial location problems, the main obstacle is no longer the absence of data. It is the fragmentation of sources, uneven data quality and the difficulty of combining information collected for different purposes. This is precisely where GeoAI can add value: by bringing machine learning, text analysis and other computational methods into geospatial decision support.
The European Commission’s 2025 Open Data Maturity Report places Poland among Europe’s leading countries in overall open-data maturity.[1] The report is not a ranking of national GIS resources, so it should not be used as one. Its result is nevertheless consistent with what a review of Polish public datasets suggests: there is already a broad base of spatial, statistical, economic and administrative information that can support investment decisions.
The rest of this article looks at how these resources can be combined and analysed to answer practical questions about industrial location.
What data are already available?
The table below summarises the main data families relevant to industrial real estate and site selection. The distinction between public and commercial sources matters. Professional analysis rarely relies on open data alone.
| Group | Data | Data form | Public availability | Typical spatial detail | Main public sources | Commercial / directly acquired complement |
|---|---|---|---|---|---|---|
| Reference data | Cadastral parcels | vector | YES / PARTIAL | parcel | EGiB, Geoportal | full cadastral extracts, ownership information |
| Buildings | vector / 3D | YES / PARTIAL | building | EGiB, BDOT10k, Geoportal | enriched property databases | |
| Administrative boundaries | vector | YES | administrative unit | PRG, GUGiK | — | |
| Address points | point | YES | address | PRG, EMUiA, GUGiK | HERE, TomTom, Google | |
| Terrain models | raster / point cloud | YES | c. 1 m and locally finer | NMT, NMPT, LiDAR, GUGiK | commissioned surveys and photogrammetry | |
| Orthophotos | raster | YES | commonly 5–10 cm, locally finer | GUGiK, Geoportal | commissioned aerial surveys | |
| Land cover and use | vector / raster | YES / PARTIAL | object / 10 m for Sentinel-2 | BDOT10k, Sentinel | thematic commercial data | |
| Road and rail networks | network / vector | YES / PARTIAL | network segment | BDOT10k, OSM, infrastructure managers | HERE, TomTom, PTV | |
| Planning and legal status | Local zoning plans | vector / document | YES / PARTIAL | parcel / planning zone | Urban Register, BIP, municipalities | aggregated planning databases |
| General plans and spatial policy | vector / document | YES / PARTIAL | planning zone / municipality | Urban Register, BIP | planning databases | |
| Property ownership | register | RESTRICTED | property | EGiB and EKW within legal access rules | legal due diligence | |
| Cadastral information | vector / table | PARTIAL | parcel / building | EGiB, Geoportal | official extracts | |
| Permits and administrative decisions | table / document / location | YES / PARTIAL | project / parcel | RWDZ, BIP | development databases | |
| Environmental constraints | vector / document | YES | parcel / zone | GDOŚ, Wody Polskie, PIG-PIB, GIOŚ | specialist studies | |
| Protected areas | vector | YES | area / parcel | GDOŚ | — | |
| Easements and other property rights | register / document | RESTRICTED | property | land and mortgage registers where the register number is known | legal due diligence | |
| Development restrictions | derived data | PARTIAL | parcel | planning data, GDOŚ, Wody Polskie, PIG-PIB, heritage registers | development due diligence | |
| Transport and logistics | Access to major roads | network / vector | YES | parcel–junction / road segment | GDDKiA, BDOT10k, OSM | HERE, TomTom, PTV |
| Travel times | network / time series | PARTIAL | origin–destination pair | OSM, GDDKiA, local ITS | HERE, TomTom, fleet data | |
| Rail terminals and sidings | point / line | PARTIAL | facility | UTK, PKP PLK, OSM | logistics databases | |
| Ports | point / object | PARTIAL | port / terminal | port authorities, GUS, OSM | logistics databases | |
| Airports | point / object | YES | airport | ULC, BDOT10k, OSM | — | |
| Intermodal terminals | point | PARTIAL | terminal | UTK, OSM, operators | logistics databases | |
| Traffic and congestion | time series / network segments | PARTIAL | road segment | GDDKiA, local ITS | TomTom, HERE | |
| HGV restrictions | network / attribute | PARTIAL | road segment | road authorities, OSM | truck-routing systems | |
| Traffic counts | table / point / segment | YES | point / road segment | GDDKiA | — | |
| Route cost and path | derived data | PARTIAL | origin–destination pair | road networks + public toll data | PTV, HERE, TomTom | |
| Supplier and customer accessibility | derived / network | PARTIAL | company–facility / route | business registers + transport networks | supply-chain databases | |
| Utilities | Power networks and available capacity | network / table | PARTIAL | network segment / connection point | GESUT, PSE, utilities | direct utility enquiries |
| Substations | point / object | PARTIAL | facility | PSE, GESUT, OSM | utilities | |
| Gas networks | network | PARTIAL | network segment | GESUT, GAZ-SYSTEM | utilities | |
| Water networks | network | PARTIAL | network segment | GESUT, municipal utilities | utilities | |
| Wastewater networks | network | PARTIAL | network segment | GESUT, municipal utilities | utilities | |
| Telecommunications | network / point / address | PARTIAL | address / network segment | internet.gov.pl, SIDUSIS, GESUT | operators | |
| District heating | network | PARTIAL | network segment | GESUT, URE, local operators | operators | |
| Renewable-energy potential | raster / time series | YES / PARTIAL | raster / location | IMGW, public meteorological data | Solargis and similar services | |
| Environment and site conditions | Elevation and slope | raster / point cloud | YES | c. 1 m | NMT, LiDAR, GUGiK | site surveys |
| Geology | vector / profiles / boreholes | YES | depends on source | PIG-PIB, CBDG | geotechnical investigations | |
| Groundwater | vector / point | YES / PARTIAL | hydrogeological unit / borehole | PIG-PIB, Wody Polskie | local investigations | |
| Flood risk | vector / raster | YES | parcel / zone | Wody Polskie | — | |
| Soil conditions | vector / map | PARTIAL | depends on source | IUNG, PIG-PIB | geotechnical investigations | |
| Soil contamination | point / area / document | PARTIAL | property / area | GDOŚ | environmental site assessments | |
| Noise | raster / contours | PARTIAL | local | GIOŚ, municipalities | measurements | |
| Air quality | point / raster / time series | YES | station / modelled raster | GIOŚ | — | |
| Natura 2000 and other protected areas | vector | YES | area | GDOŚ | — | |
| Climate and heat risk | raster / time series | YES / PARTIAL | raster / region | IMGW, public climate models | specialist risk databases | |
| Population and labour | Population | table / grid | YES | statistical grid / municipality | GUS | — |
| Labour supply | table | YES / PARTIAL | municipality / county | GUS | commercial labour analytics | |
| Unemployment | table | YES | county / region | GUS, labour offices | — | |
| Wages | table | YES / PARTIAL | county / region | GUS | salary surveys | |
| Skills and occupations | table | PARTIAL | region / county | GUS, education and labour sources | recruitment databases and employer surveys | |
| Commuting | flow matrix | YES, periodically | municipality–municipality | GUS, census | mobile-network data | |
| Demographic structure | table / grid | YES | grid / municipality | GUS | — | |
| Education | table / point | YES / PARTIAL | institution / territorial unit | GUS, education registers | — | |
| Migration | table | YES / PARTIAL | municipality / county / region | GUS | — | |
| Industrial real-estate market | Existing industrial and logistics stock | point / object / table | PARTIAL | building / park | EGiB, BDOT10k, OSM, market reports | REDD, brokers |
| Warehouse locations | point / object | PARTIAL | building | OSM, BDOT10k, company websites | REDD, brokers | |
| Building areas | vector / table | PARTIAL | building | EGiB, building geometry | owners, brokers | |
| Vacancy | table | NO at property level | building / unit | aggregate market reports | REDD, brokers | |
| Rents | table | PARTIAL | market / property | market reports | brokers, landlords | |
| Transaction prices | table / object | YES / expanding | transaction / property | RCN | Cenatorium, MSCI, brokers | |
| Land asking prices | table / point | PARTIAL | listing / parcel | listing portals | portal analytics, brokers | |
| Development pipeline | table / document / location | PARTIAL | project / parcel | RWDZ, company announcements | REDD, brokers | |
| Take-up and absorption | table | NO at property level | market / park | aggregate reports | brokers | |
| Developers and owners | table / relationship graph | PARTIAL | entity / property | KRS, CEIDG, company disclosures | commercial databases | |
| Occupiers and tenants | table / point | PARTIAL | company / property | company announcements and websites | leasing and company databases | |
| Business geography | Company registers | table | YES | legal entity | CEIDG, REGON, KRS | D&B, EMIS, Coface and others |
| Establishment locations | point / address | PARTIAL | establishment / address | REGON, CEIDG, company websites | commercial company databases | |
| Industry classifications | table | YES | company | PKD, REGON, CEIDG, KRS | — | |
| Company employment | table | PARTIAL | company / territorial unit | aggregated GUS data | company databases | |
| Financial information | table / document | PARTIAL | company | KRS, company reports | EMIS, D&B and others | |
| Suppliers | relationship graph / table | RESTRICTED | company relationship | public procurement, company disclosures | supply-chain databases | |
| Customers | relationship graph / table | RESTRICTED | company relationship | company disclosures | supply-chain databases | |
| Industrial clusters | derived data | PARTIAL | cluster / region | company registers + spatial data | commercial databases | |
| Earth observation | Sentinel | raster / time series | YES | 10–60 m depending on band | Copernicus Data Space | — |
| Landsat | raster / time series | YES | commonly 30 m | USGS / Landsat | — | |
| High-resolution commercial satellite imagery | raster | NO | sub-metre possible | — | Maxar, Planet, Airbus, ICEYE | |
| Aerial imagery | raster | PARTIAL | centimetres | GUGiK orthophotos | commissioned flights | |
| LiDAR | point cloud | YES | point / object | GUGiK | commissioned surveys | |
| Satellite SAR | raster / time series | YES / PARTIAL | sensor dependent | Sentinel-1 | ICEYE, Capella | |
| Movement of people and goods | Mobile-network mobility data | flows / time series | NO at useful detail | aggregated zones | — | mobile operators |
| GPS traces | trajectories | RESTRICTED | device / vehicle | limited research datasets | fleets, telematics | |
| Floating-car / observed vehicle movement data | time series / network | RESTRICTED | road segment | local ITS | TomTom, HERE | |
| Public-transport usage | table / time series | PARTIAL | line / stop | municipalities, GTFS, GUS | operators | |
| Footfall | point / time series | PARTIAL | point / zone | local counts | mobile operators, retail analytics | |
| Commuting | flow matrix | YES, periodically | municipality–municipality | GUS | telecom data | |
| Freight movement | table / flows | PARTIAL | corridor / region | GUS, roads, rail, ports | logistics and shipment data | |
| Web and volunteered data | OpenStreetMap | vector / network | YES | object | OSM | — |
| Business directories | table / point | PARTIAL | company / address | CEIDG, REGON | commercial directories | |
| Websites | text / document | PARTIAL | page / entity | public web | specialist databases | |
| Real-estate listings | text / table / point | visible, usually not open in bulk | listing | listing portals | portal analytics | |
| POIs | point / vector | YES / PARTIAL | object | OSM, Wikidata | HERE, TomTom, Foursquare, Google | |
| Crowdsourced data | various | licence dependent | object | OSM, Wikidata | — | |
| Location-linked documents | Planning documents | text / vector | YES / PARTIAL | document / area | Urban Register, BIP | planning databases |
| Environmental decisions | document / location | PARTIAL | project / parcel | Ekoportal, OOŚ database, RDOŚ, BIP | development databases | |
| Permits | document / location | YES / PARTIAL | project / parcel | RWDZ | development databases | |
| Municipal strategies | document | PARTIAL | municipality | BIP, municipal websites | — | |
| Infrastructure plans | document / map | PARTIAL | region / network | PSE, GDDKiA, PKP PLK, GAZ-SYSTEM | utilities | |
| Company announcements | text / document | PARTIAL | company / project | ESPI, EBI, company websites | business-information databases | |
| Investment and market reports | document | PARTIAL | market / region | PAIH, broker reports | paid reports and databases | |
| Tender documentation | document | YES | procedure / project | e-Zamówienia, BZP, TED | — | |
| Company data | Plant locations | point / object | NO for internal data | plant | — | company records |
| Supplier and customer database | table / relationship graph | NO | company / relationship | — | ERP, CRM, SRM | |
| Shipments and transport | table / trajectory | NO | shipment / route | — | TMS, WMS | |
| Production | time series / table | NO | line / machine / job | — | MES, SCADA | |
| Workforce and organisation | table | NO | employee / team / plant | — | HRIS | |
| Energy use | time series | NO | meter / device / building | — | EMS, BMS | |
| Operational KPIs | time series / table | NO | process / line / plant | — | company systems | |
| CAPEX | table | NO | project / asset | — | financial systems | |
| Maintenance | table / time series | NO | asset | — | CMMS, EAM | |
| Building and operations | Building geometry and information model | BIM / 3D | NO for private assets | building element | public 3D models only as context | BIM model supplied by investor or occupier |
| Room and equipment locations | BIM / point / object | NO | room / asset | — | BIM, as-built documentation | |
| Asset registers | table / BIM | NO | asset | — | EAM, CMMS, BIM | |
| Energy meters | time series | NO | meter / asset | — | BMS, EMS, IoT | |
| Environmental sensors | time series | NO | sensor / zone | — | BMS, IoT | |
| Production sensors | time series | NO | machine / line | — | MES, SCADA, IoT | |
| Movement inside the facility | trajectories / events | NO | person / vehicle / zone | — | RFID, UWB, internal systems |
The strongest part of Poland’s public-data base concerns the location and characteristics of physical objects: parcels, buildings, roads, terrain, environmental constraints and administrative divisions. As analysis moves closer to an actual business decision and plant operation, commercial and proprietary information becomes more important. Utility availability, lease terms, supply-chain relationships, freight flows and operational data often have to be obtained from companies, infrastructure operators, municipalities, landlords or specialist providers.
This is not a uniquely Polish weakness. Detailed information on actual utility capacity, rents, supply chains, shipment flows or plant operations is commercially sensitive or proprietary in most markets.
From maps to decision models
The same datasets can support very different levels of analysis. The simplest question is: what is located where? The next step is to combine layers and compare alternatives against explicit criteria. More advanced methods can identify recurring patterns, estimate values or classes, analyse relationships in networks and extract information automatically from documents.
In their systematic review of GeoAI, Siqin Wang and colleagues distinguish raster imagery, vector data, spatiotemporal flows, official statistics and text among the main data types used in the field. These data are used for tasks such as classification, prediction, simulation, automated feature extraction and geoparsing.[2]
This progression builds on established spatial decision-support methods. Jacek Malczewski described GIS-based multicriteria decision analysis as a way of combining geographical information with the evaluation of alternatives in order to produce information for decision-making.[3] GeoAI extends that toolbox with methods capable of learning patterns from large and heterogeneous datasets.
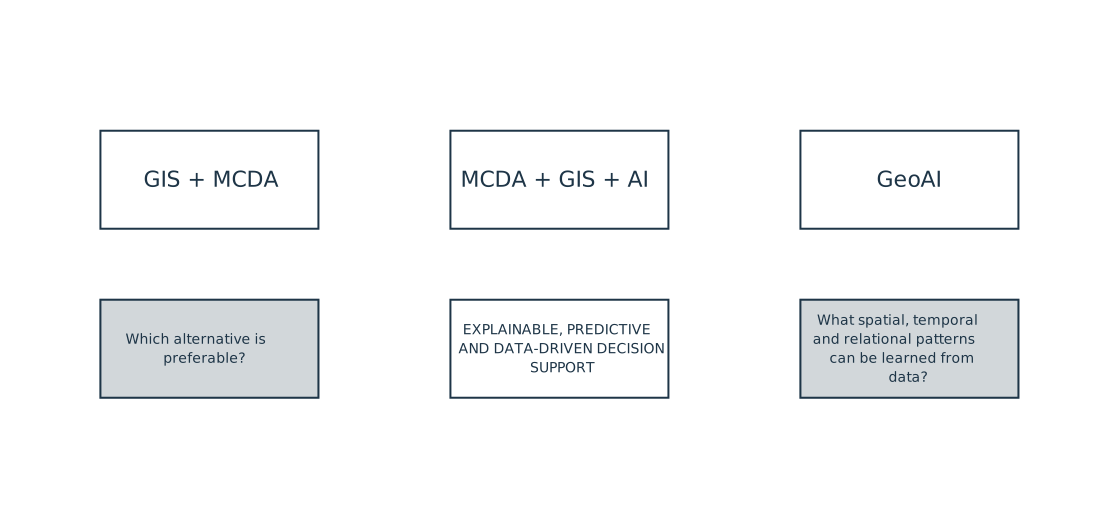
In their review of 149 industrial site-selection studies, Dongbo Wang and colleagues show that research is increasingly combining multicriteria decision-making, GIS and artificial intelligence.[4] One direction is the integration of imagery, text, vector data and sensor observations within a single analytical workflow. Another is the use of knowledge graphs to represent relationships among companies, sites and infrastructure, and graph neural networks to learn from those relationships. A further strand of research focuses on explainability: not only producing a ranking or prediction, but also showing why a model preferred one location over another.
One decision spans several spatial scales
Industrial location decisions should be assessed across several scales, from the regional context down to the individual property and its surroundings.
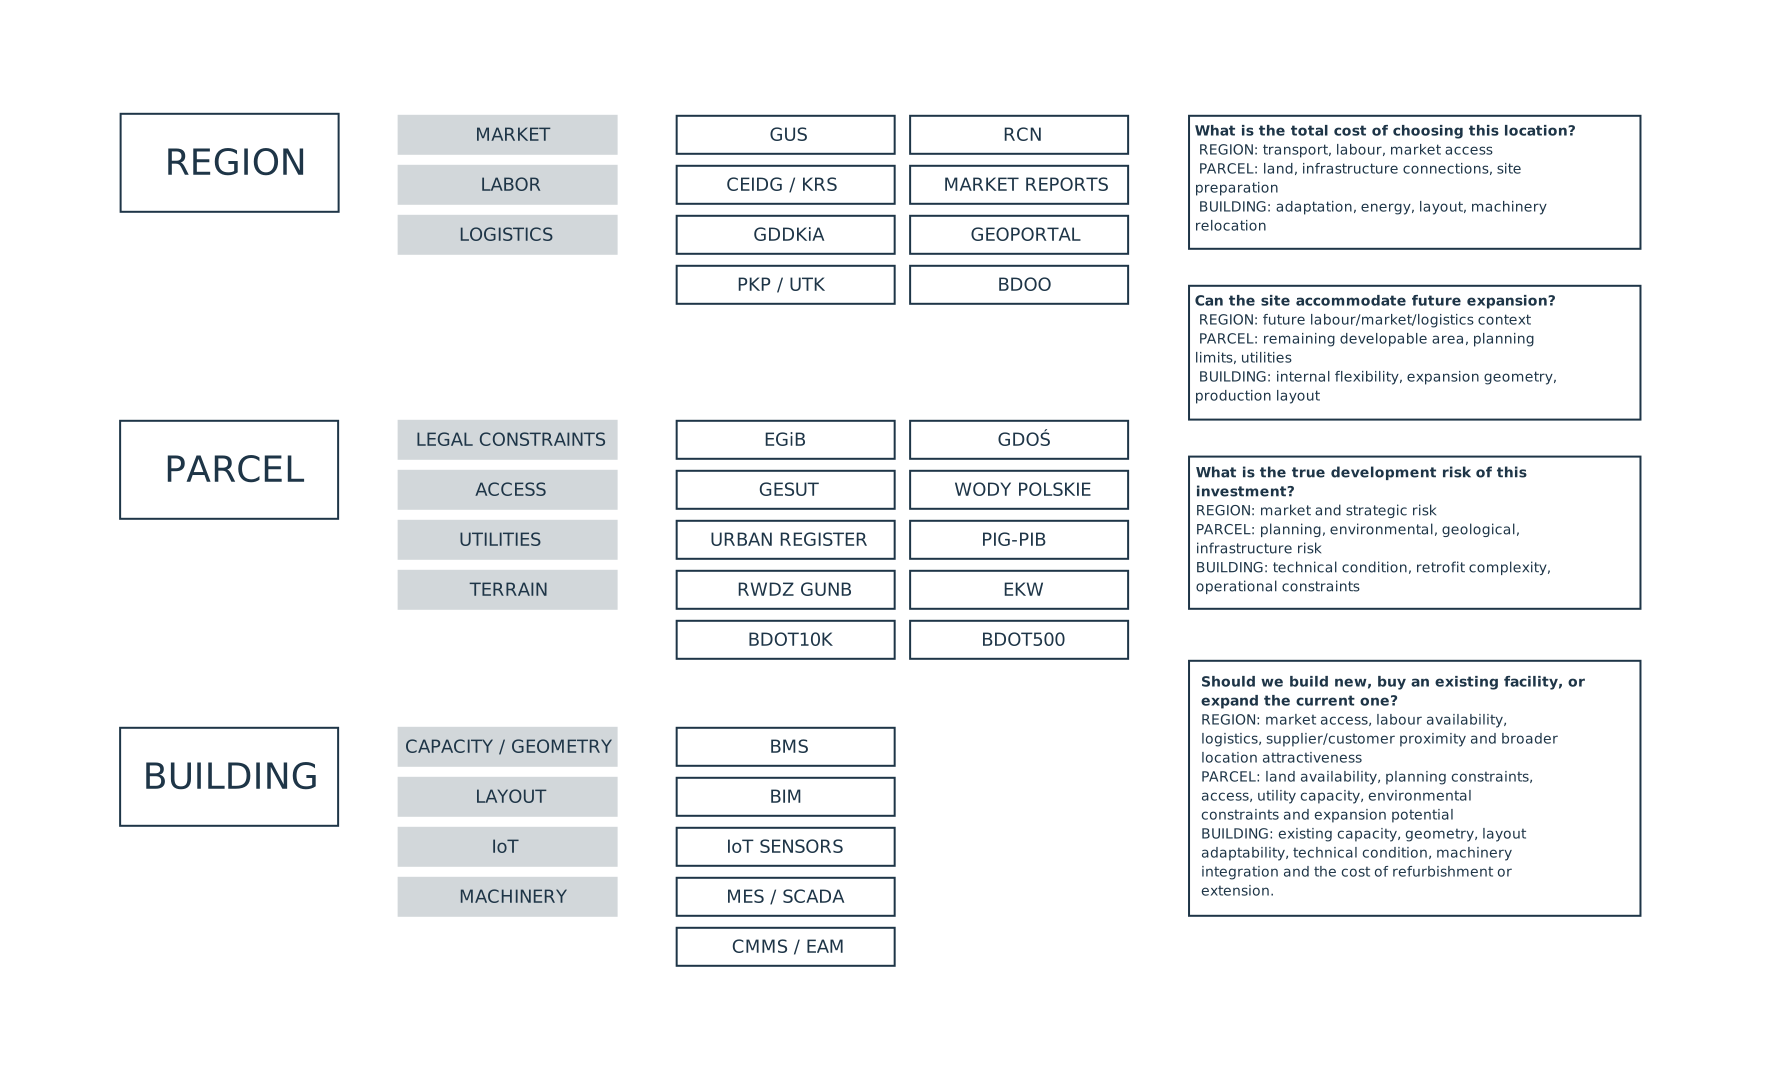
At the regional level, the main issues are labour availability, access to customers and suppliers, transport connections and local market conditions. At the parcel level, the analysis shifts to development rights, planning constraints, road access, utilities, terrain, environmental restrictions and room for future expansion. If an existing building is under consideration, the analysis must also determine whether its geometry, clear height, structural grid, building services and internal layout can accommodate the intended production process.
Some questions necessarily cut across these scales. “Where should we locate the new plant?” requires a regional comparison first and a property-level assessment second. An even broader decision is “Should we build a new facility, acquire an existing one or expand the current plant?”. That requires a simultaneous comparison of market and logistics conditions, parcel development potential and utility access, and the adaptability of existing buildings.
Location analysis, understood in this way, goes beyond producing a suitability map. Its purpose is to compare real investment alternatives.
Polish applications already exist
Marcin Hernes and colleagues provide a useful Polish example of combining real-estate information with spatial variables and machine learning. Their study used 148 transactions involving investment land in Wrocław. Transaction records were supplemented with information on zoning, development intensity, infrastructure, road access, public transport, distances, flood hazard and surrounding nuisances.[5]
The authors compared multiple regression, random forest and an artificial neural network. In this particular sample, the neural network achieved a mean absolute percentage error (MAPE) of 13%, compared with 22.2% for multiple regression and 26.3% for random forest.[6] This should not be interpreted as evidence that neural networks will always outperform other methods. The more important point is that combining market and spatial variables produced a useful analytical model, while the limited number of transactions remained a major constraint.[7]
The question for Poland is therefore no longer whether such analysis is technically possible. It is how to move from isolated experiments to repeatable workflows that combine public, commercial and company data.
Not only the West and China
Quantitative and spatial methods for facility location are not developing only in the United States, Western Europe and China. Serena Fugaro and Antonino Sgalambro reviewed 288 papers on multi-objective facility-location problems published between 2011 and 2025. Among the 143 studies that used case studies, Iran accounted for 23.0% and China for 22.7%, followed by Turkey and North America.[8]
The industrial site-selection literature also includes specific Iranian examples, such as wind-farm siting in Semnan Province and industrial site-selection studies in Isfahan.[9]
These figures should not be read as evidence that Iran has more operational deployments than Poland. Fugaro and Sgalambro note that many case studies are used to validate methods on realistic data rather than to document tools that have been implemented in day-to-day practice.[8] The comparison is nevertheless revealing: serious work on computational location analysis is being carried out across a much wider range of countries than the usual focus on the largest technology centres might suggest.
The data are here. The next task is to use them better.
Poland does not need to wait for a new generation of spatial-data infrastructure before developing GeoAI applications. Much of the necessary foundation already exists. The priority is to connect sources reliably, control data quality and build analytical workflows that translate those resources into answers to real investment questions.
GeoAI is one part of a broader decision-support toolbox. Depending on the problem, GIS, multicriteria analysis, operations research, statistics, network analysis, text processing and conventional modelling will remain equally important. The objective is not to apply artificial intelligence for its own sake. It is to make better decisions by combining the right data with the right methods.
The literature shows that this approach is developing not only in the United States, Western Europe and China, but also in countries such as Iran. The question is therefore no longer whether GeoAI can be applied to industrial site selection. The question is why Poland — with such a substantial public-data foundation already in place — should not become one of the countries where these methods are developed and used in practice.
References
- European Commission / data.europa.eu, 2025 Open Data Maturity Report. ↩
- Wang, S. et al., “Mapping the landscape and roadmap of geospatial artificial intelligence (GeoAI) in quantitative human geography: An extensive systematic review”, International Journal of Applied Earth Observation and Geoinformation, 128 (2024), 103734, p. 5. ↩
- Malczewski, J., “GIS-based multicriteria decision analysis: a survey of the literature”, International Journal of Geographical Information Science, 20(7) (2006), 703–726, pp. 703–704. ↩
- Wang, D., Zhu, Y., Mao, X., Wang, J., Ji, X., “Industrial Site Selection: Methodologies, Advances and Challenges”, Applied Sciences, 15 (2025), 11379, pp. 22–26. ↩
- Hernes, M., Tutak, P., Nadolny, M., Mazurek, A., “Real estate valuation using machine learning”, Procedia Computer Science, 246 (2024), 4592–4599, p. 4596. ↩
- Hernes, M. et al., ibid., pp. 4596–4597. ↩
- Hernes, M. et al., ibid., p. 4598. ↩
- Fugaro, S., Sgalambro, A., “Multi-Objective Facility Location Problems: Systematic Literature Review and research agenda”, Computers & Industrial Engineering, 216 (2026), 111994, p. 7 and the discussion of case-study use later in the paper. ↩
- Yousefi, H., Motlagh, S.G., Montazeri, M., “Multi-Criteria Decision-Making System for Wind Farm Site-Selection Using Geographic Information System (GIS): Case Study of Semnan Province, Iran”, Sustainability, 14 (2022), 7640; Reisi, M., Afzali, A., Aye, L., “Applications of analytical hierarchy process (AHP) and analytical network process (ANP) for industrial site selections in Isfahan, Iran”, Environmental Earth Sciences, 77 (2018), 537. ↩
Abbreviations used in the table
BIM — Building Information Modeling: a digital representation of building geometry and associated technical information.
BMS — Building Management System: a system used to monitor and control building services such as heating, ventilation, cooling, lighting and energy consumption.
IoT — Internet of Things: connected devices and sensors that automatically collect and transmit data.
MES — Manufacturing Execution System: software used to monitor and manage production execution at plant level.
SCADA — Supervisory Control and Data Acquisition: systems used to monitor, control and collect data from industrial processes.