1. What is spatial decision support?
Many strategic decisions in manufacturing, logistics, and industrial real estate have an inherently spatial dimension. They include choosing a region for a new plant, selecting a specific site, assessing access to infrastructure and labour, positioning facilities within a distribution network, and comparing properties for acquisition or expansion. In each case, location affects cost, transport time, access to resources, investment risk, and the company’s ability to grow.
A Geographic Information System (GIS) is used to collect and integrate spatial data, analyse distance, proximity and accessibility, and present the results on maps. Not every GIS analysis, however, constitutes a decision support system. A Spatial Decision Support System (SDSS) combines spatial and non-spatial data, GIS-based analytical functions, and an explicit model of the decision problem. Its purpose is not merely to describe a situation, but to compare alternatives, expose trade-offs, and test the consequences of different assumptions.[1]
That distinction matters in business practice. A map of available sites may be a valuable source of information, but it does not by itself determine which location best supports the investor’s objectives. A model that estimates warehouse rents may describe the market well, but it does not decide whether a particular property should be acquired. The value of SDSS lies in creating a coherent process that connects information with a business decision.
2. From data to decision
The starting point is the decision problem, not the software or algorithm. An investment project typically requires information from several sources: site and building data, acquisition and development costs, transport and infrastructure parameters, customer and supplier locations, labour-market information, planning conditions, regulatory constraints, and market data.
For project purposes, these inputs are usually organised into several thematic groups:
- property and site,
- costs and investment parameters,
- transport and infrastructure,
- market and industrial ecosystem,
- labour market and demand,
- planning and institutional conditions.
Time is not a separate data category. It is an additional dimension that may apply to all of them. Land prices, labour availability, infrastructure capacity, warehouse rents, or land-use patterns may be analysed as conditions at a given point in time or as variables observed over time.
One of the defining strengths of SDSS is its ability to combine internal company data with external information. Keenan and Jankowski illustrate this with a simple location-analysis example: the distribution of existing customers may provide the initial picture, while adding the road network, demographic data, and utility information produces a much richer representation of the decision context.[1]
Not all information serves the same purpose. Some variables define hard constraints, such as minimum site area, required zoning, maximum distance from a motorway, or sufficient grid capacity. Other variables help compare sites that already satisfy those basic conditions: land cost, labour availability, distance to customers, planning risk, or expansion potential. A further set of data is needed for forecasting, optimisation, or risk analysis.
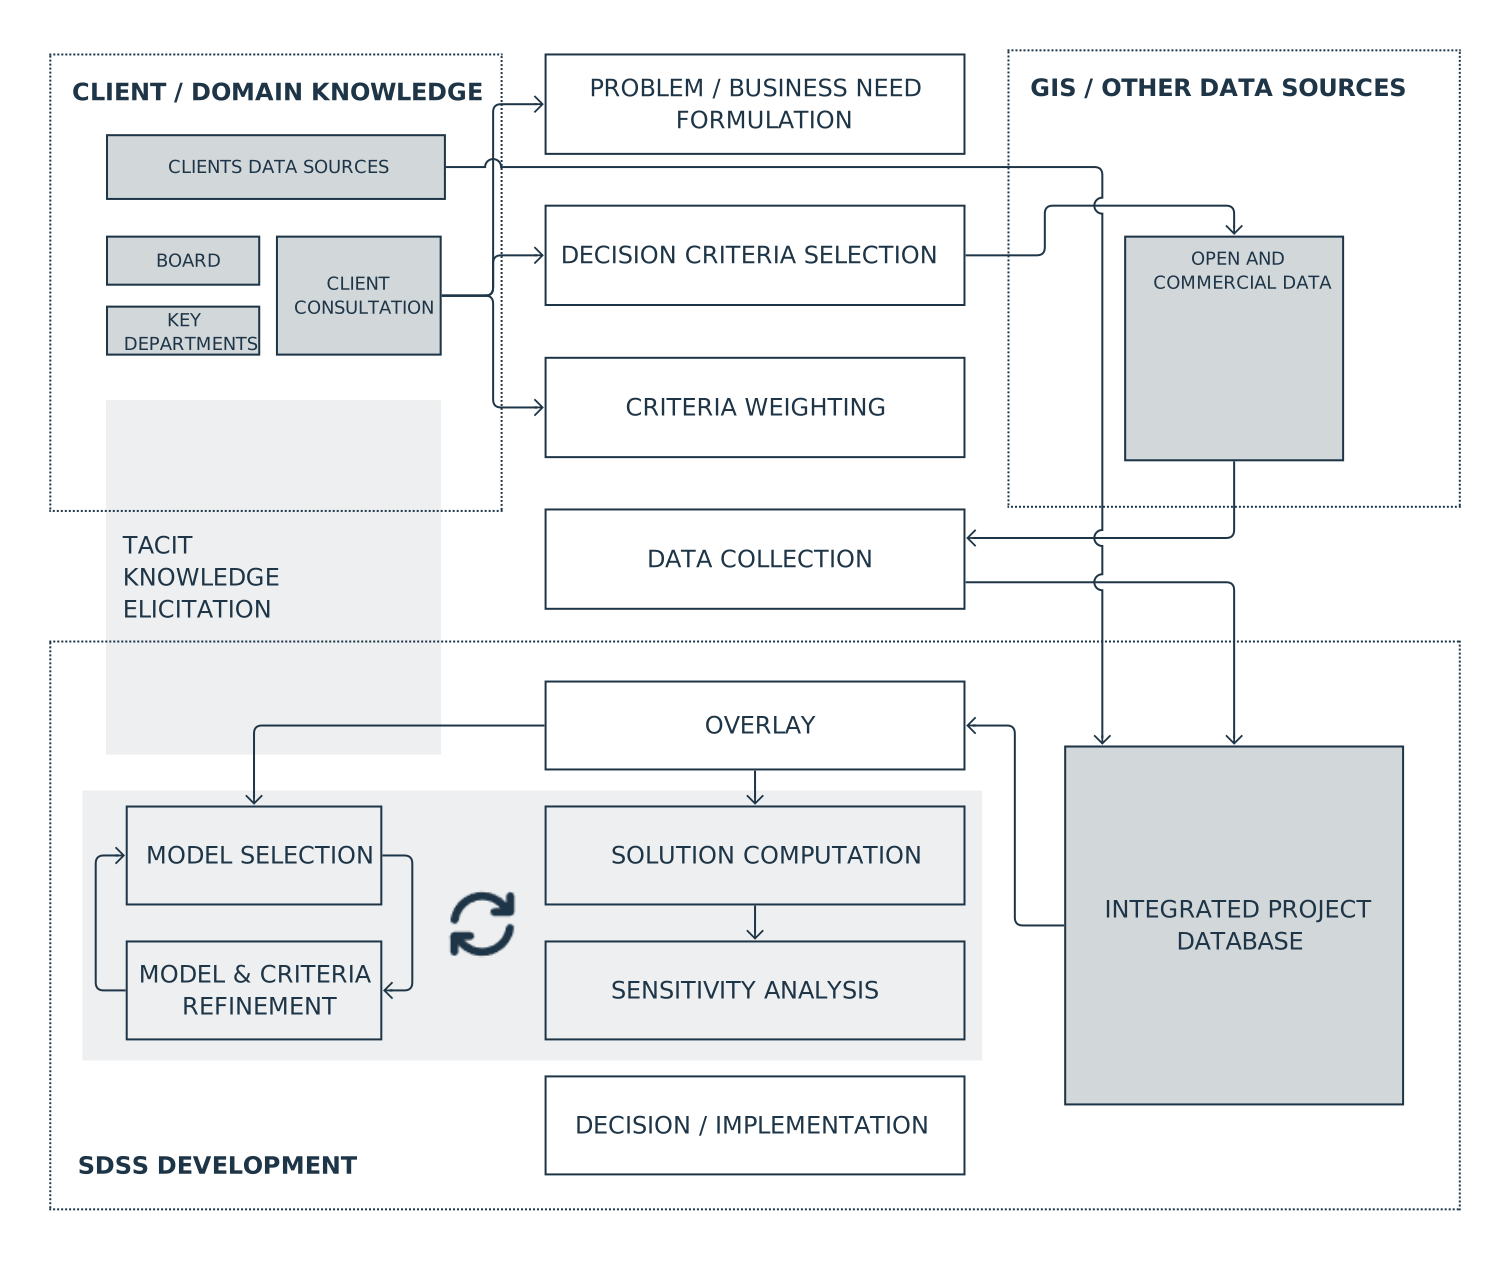
There is therefore no single universal SDSS workflow. Depending on the decision, the process includes defining business objectives, identifying constraints, preparing data, generating feasible alternatives, establishing evaluation criteria, comparing or optimising alternatives, testing sensitivity, and preparing a recommendation. The scope and sequence of these stages follow from the nature of the problem.
3. SDSS is built with the client, not for the client
A well-designed decision support system is not a finished product built by an analyst and handed over after the calculations are complete. It develops through continuous collaboration with the organisation whose decisions it is intended to support. Geertman and Stillwell emphasise that decision-support systems should be driven by user needs rather than by the availability of a particular technology, and that their usefulness depends strongly on the context in which they are applied.[2]
In a manufacturing or logistics company, that means speaking not only with the board or with the authors of the corporate strategy. Their knowledge is essential for defining investment objectives and acceptable levels of risk, but a significant part of the information required to model operations properly often sits deeper within the organisation.
A warehouse supervisor may know which activities create recurring bottlenecks even though the problem does not appear in formal reporting. A logistics manager may understand route constraints that standard travel-time analysis does not capture. The procurement team may know which suppliers are consistently reliable and which can increase volumes at short notice. Maintenance staff may identify relationships between building layout and service costs that are not evident in design documentation.
This is tacit knowledge: knowledge derived from practice and experience that has not been formalised in databases, procedures, or reports. A strong analyst treats it as seriously as numerical data. The task is not simply to process information supplied by the client, but to help uncover, structure, and translate that knowledge into criteria, constraints, and assumptions that the model can use.
The process is iterative. The first step is to define the problem and identify the available data. The initial representation is then checked against the way the business actually operates. Early results are discussed with the people responsible for the relevant processes. Missing information, conflicting assumptions, or unexpected consequences lead to revisions of the model. This collaboration is not an optional layer added to the analysis. It is part of the method.
Handled well, the process also has a diagnostic and integrative effect on the organisation. Defining decision criteria together often exposes a gap between what the company formally treats as a priority and what actually constrains day-to-day operations. The logistics and procurement teams may assess the same suppliers differently. The board may understand operational flexibility differently from the production team. Two departments may even be working with different versions of the same underlying data.
The final model is therefore not the only source of value. Building it forces assumptions into the open, organises dispersed knowledge, reveals hidden problems, and creates a shared language across functions. In this sense, a well-run SDSS project can improve not only a specific investment decision but also communication between departments.
4. Initial site screening and multi-criteria analysis
The most obvious industrial application of SDSS is location selection. Yet the process does not necessarily begin with a shortlist of known sites. When the search area covers a large region or several countries, the first task is usually to narrow the search space.
At this stage, GIS is used to eliminate areas that fail basic requirements because of planning status, insufficient site area, inadequate infrastructure access, or distance from the required transport network. It is then used to calculate transport accessibility, proximity to customers and suppliers, labour-market access, and other indicators relevant to the project.
The study by Raad, Rajendran and Salimi on dry-port location illustrates this staged approach well. The authors first established the factors relevant to location, then used spatial data to identify areas that met the basic requirements, and only afterwards compared the remaining candidates using additional criteria.[3] The important point is not the name of the mathematical technique. It is the separation of two distinct tasks: first narrowing the search area, and then comparing the alternatives that remain.
Once the realistic options have been reduced to a manageable number, multi-criteria analysis becomes useful. Its role is to structure a decision in which several factors and objectives matter at the same time. The cheapest site may not offer the best labour access. A well-connected site may offer limited expansion potential. A technically attractive property may carry higher planning risk.
Keenan and Jankowski identify multi-criteria analysis as one of the major families of methods used in SDSS, especially in land suitability, site search, site selection, and resource-allocation problems.[1] In business practice, its value lies in forcing the organisation to state explicitly which criteria matter and how competing objectives should be balanced.
Shahparvari and colleagues divided their logistics-hub location process into several stages. Spatial data was first used to identify promising regions. A small number of candidate sites was then selected. In the final stage, the alternatives were compared across multiple criteria and ranked.[4] From a management perspective, the value of this example lies in the structure of the process: one set of tools supports regional screening, another supports candidate selection, and another supports final comparison.
5. When ranking sites is not enough
Comparing a set of known properties and searching for an optimal location are different types of problems. In the first case, the alternatives are already given. In the second, the location itself becomes part of the calculation and is often linked to other decisions concerning supply, distribution, or market coverage.
In a simple location model, the objective may be to find the plant location that minimises the combined cost of transporting raw materials to the facility and finished goods to customers. Murray, Church and Feng examine a more demanding situation in which several potential suppliers exist for each required input. Supplier choice depends on plant location because transport cost changes with distance; at the same time, the selected suppliers influence where the plant should be located. Plant location and sourcing therefore have to be treated as a single, interdependent problem.[5]
For management, the difference is substantial. A multi-criteria assessment may answer: “Which of these five properties best fits our requirements?” An optimisation model may instead answer: “Where should the plant be located if supplier locations, customer demand, shipment volumes, and transport costs are considered together?” The second question is not a more detailed ranking exercise. It is a different decision problem and may point to a location that was not part of the original shortlist.
The way distance is represented also matters. In logistics, straight-line distance is often a poor proxy for actual travel. Vehicles move through a road network shaped by junctions, one-way restrictions, and the geometry of available routes. In one of the studies reviewed, replacing simple geometric distances with road-network distances produced a better representation of the actual transport conditions.[6] The broader lesson is important: a better decision model does not necessarily come from a more sophisticated algorithm. It often comes from a more faithful representation of the real business problem.
6. Market data as a source of location intelligence
Not every spatial analysis is intended to select a site directly. In some cases, the more important task is to understand which factors actually influence business behaviour or property value.
Yang, Chen, Pan and Yuan analysed the spatial distribution of logistics facilities in Shanghai. Their variables included population density, industrial and warehousing land-use designations, distance from the city centre, ports, freight rail terminals and motorway interchanges, and the concentration of industrial establishments.[7]
The results show why location criteria should not be treated as universally valid. In the study area, proximity to freight rail terminals was significantly associated with the location of new logistics facilities, while the effect of distance from the nearest motorway interchange was much less pronounced. The authors link this in part to the maturity of the road network, which reduced differences in accessibility across the city.
This kind of analysis does not produce an investment recommendation on its own. Its role is to test whether factors assumed to be important in a decision model actually differentiate the market in a given place and period. The findings then become one source of evidence used when defining or calibrating decision criteria.
7. How should the importance of criteria be determined?
One of the most important stages in multi-criteria analysis is deciding which criteria actually matter to a particular client. This is not a purely technical task. The weights assigned to criteria should reflect business objectives, operational constraints, and the experience of the people responsible for the relevant processes.
A straightforward approach is to ask project participants to assess the importance of each criterion. Hammond and colleagues used this approach when developing a decision-support system for brownfield redevelopment. Prospective users were presented with a list of criteria and asked to rate their importance on a scale from 1 to 10 for specific land-use outcomes. Average scores were then used as weights in the model.[8]
A second example comes from Önden, Eldemir, Acar and Çancı, who studied the location of logistics centres in Istanbul. The authors first defined the criteria, then gathered assessments from participants with knowledge of the transport and logistics sector, and used those responses to establish the relative importance of the factors used in the spatial analysis. They also examined scenarios reflecting the perspectives of different areas of expertise.[9]
In a commercial project, strategic priorities defined by the board need to be tested against the knowledge of logistics, procurement, production, HR, maintenance, and warehouse operations. Disagreement is not a problem to be eliminated quickly; it is information about the organisation. If two departments attach very different importance to the same criterion, the first task is to understand why.
Exact numerical weights are not always necessary. Harju, Liesiö and Virtanen show that spatial decision analysis can also work with incomplete preference information. A decision-maker may know that one criterion is more important than another, or that one alternative is preferable to another, without being able to justify a precise numerical weight. The analysis can then consider a range of admissible preferences rather than forcing the organisation into a single, artificially precise weighting scheme.[10]
A well-designed weighting process therefore serves two purposes at once. It translates organisational knowledge into the structure of the model, and it reveals unclear objectives, competing priorities, and assumptions that require an explicit management decision.
8. Sensitivity analysis: how much does the recommendation depend on the assumptions?
Any model result depends on its data, criteria, and assumptions. Sensitivity analysis is used to determine which of those assumptions actually drive the recommendation. For decision-makers, this provides information about the strength of the decision itself: does one option remain clearly preferable under a reasonable range of assumptions, or does its advantage disappear after a small change?
Energy prices, transport costs, labour availability, and production volumes change over time. Corporate priorities change as well. If a minor adjustment to the importance of one criterion reverses the ranking of sites, the recommendation should be interpreted more cautiously. If the same option remains preferable across a broad range of assumptions, the decision rests on a stronger foundation.
Awasthi and colleagues tested a series of weighting scenarios in their study of distribution-centre location. One site remained the preferred option in most cases, but another became preferable when cost-related criteria were given particularly high importance.[11] For management, that result is often more useful than the simple statement that one site ranked first, because it identifies the condition under which the recommendation changes.
Raad, Rajendran and Salimi performed similar robustness checks by repeatedly varying criterion weights and observing whether the ranking remained stable.[3] In a commercial project, the same idea is often easier to communicate through a small set of scenarios grounded in plausible business changes: a base case, a high-energy-cost scenario, a scenario in which labour availability becomes more important, or a scenario based on higher production volumes. Management then receives not only a recommendation, but also an understanding of the conditions under which it remains valid.
9. From a single analysis to a decision-support system
A professional SDSS brings together several models, multiple data sources, and a common interface that allows users to move from a portfolio-level view to the detailed analysis of a single property.
The work of Hammond and colleagues on brownfield redevelopment provides a useful example of this type of architecture. Their WebGIS-based system combined land-use potential, ground risk, and information needed to assess economic viability. In one implementation, the analysis covered 31,942 hectares of land, and the system was tested with professional users.[12]
For industrial real estate, a comparable architecture may integrate land availability, planning status, utilities, transport, labour, costs, expansion capacity, and market indicators. Its purpose is not necessarily to identify one “best” site automatically. At an early stage, the greater value may lie in identifying which locations deserve further investigation, where critical information is missing, and where due-diligence time and budget should be concentrated.
Hammond and colleagues developed their system with the participation of its intended users, tested it, and improved it iteratively. They emphasise that users should understand how the system works well enough to avoid treating it as a black box and to interpret the information appropriately.[8] In a commercial setting, this means that a decision-support system has to remain understandable to the people who rely on it, even if they do not know the mathematics behind the methods.
10. What defines a professional SDSS?
The quality of a decision-support system is not determined by the number of algorithms it contains. Even a computationally advanced system has little value if it does not address the company’s actual decision problem.
The first requirement is a well-formulated problem. Users need to understand what question the system addresses and what lies outside its scope. The second is transparency: the organisation should be able to identify which site characteristics and assumptions make a property attractive in relation to its business objectives. The third is data quality, including provenance, timeliness, and suitability for the spatial scale of the problem.
The fourth requirement is robustness to realistic changes in assumptions. The fifth is usability by the people responsible for the decision. They do not need to understand the mathematics in detail, but they do need to understand the meaning of the criteria, the consequences of the main assumptions, and the limits of the model.
Geertman and Stillwell highlight related requirements such as credibility, transparency, appropriate spatial resolution, flexibility, simplicity, validation, and data representativeness.[2] In industrial applications, another requirement deserves equal emphasis: the model has to remain connected to the knowledge of the people who understand how the business actually operates.
11. Conclusion
There is no universal algorithm for industrial location decisions. In one project, the greatest value comes from screening out areas that fail basic requirements. In another, it comes from comparing a small number of sites across multiple criteria. In a third, the key task is to optimise location together with sourcing or distribution, or to analyse the way the market behaves. Large projects may combine several of these approaches in sequence or in parallel.
The right process begins with the decision the company needs to make. Objectives, constraints, feasible alternatives, data requirements, and key uncertainties have to be defined first. The project then needs input from the people who understand how the organisation actually works — from the board to those responsible for production, logistics, procurement, maintenance, and warehouse operations.
Only then should the analytical tools be selected. In this sense, the value of geospatial data science does not lie in producing maps, rankings, or models for their own sake. It lies in building a transparent process that connects data with organisational knowledge and leads to a decision that management can understand, challenge, and implement.
A well-designed SDSS therefore answers more than the question, “Which location is best?” It also helps the organisation understand why one option is preferable, for whom it is preferable, under which assumptions that advantage holds, and which internal differences in knowledge or priorities influence the assessment. At that point, the decision-support system becomes more than an analytical tool. It becomes a structured way of conducting the decision process itself.
References
- Peter B. Keenan, Piotr Jankowski, Spatial Decision Support Systems: Three decades on, Decision Support Systems 116 (2019), pp. 64–70. ↩
- Stan Geertman, John Stillwell, Planning support science: Developments and challenges, Environment and Planning B: Urban Analytics and City Science 47(8) (2020), especially pp. 1329–1334. ↩
- Nima Golghamat Raad, Suchithra Rajendran, Soheila Salimi, A novel three-stage fuzzy GIS-MCDA approach to the dry port site selection problem: A case study of Shahid Rajaei Port in Iran, Computers & Industrial Engineering 168 (2022), pp. 1–4, 14. ↩
- Shahrooz Shahparvari, Araz Nasirian, Alireza Mohammadi, Sepideh Noori, Prem Chhetri, A GIS-LP integrated approach for the logistics hub location problem, Computers & Industrial Engineering 146 (2020), pp. 1, 6–7. ↩
- Alan T. Murray, Richard L. Church, Xin Feng, Single facility siting involving allocation decisions, European Journal of Operational Research 284 (2020), pp. 834–837. ↩
- M. A. Rahman et al., Logistics Hub Location Optimization: A K-Means and P-Median Model Hybrid Approach Using Road Network Distances, section discussing road-network distance modelling. ↩
- Zhiwei Yang, Xiaohong Chen, Ruixu Pan, Quan Yuan, Exploring location factors of logistics facilities from a spatiotemporal perspective: A case study from Shanghai, Journal of Transport Geography 100 (2022), pp. 6–8. ↩
- Ellis B. Hammond et al., The development of a novel decision support system for regional land use planning for brownfield land, Journal of Environmental Management 349 (2024), pp. 5, 12. ↩
- İsmail Önden, Fahrettin Eldemir, A. Zafer Acar, Metin Çancı, A spatial multi-criteria decision-making model for planning new logistic centers in metropolitan areas, Supply Chain Analytics 1 (2023), pp. 2–4. ↩
- Mikko Harju, Juuso Liesiö, Kai Virtanen, Spatial multi-attribute decision analysis: Axiomatic foundations and incomplete preference information, European Journal of Operational Research 275 (2019), pp. 167–168. ↩
- Anjali Awasthi, S. S. Chauhan, S. K. Goyal, A multi-criteria decision making approach for location planning for urban distribution centers under uncertainty, Mathematical and Computer Modelling 53 (2011), pp. 103–108. ↩
- Ellis B. Hammond et al., From data to decisions: Empowering brownfield redevelopment with a novel decision support system, Journal of Environmental Management 347 (2023), pp. 1–2. ↩